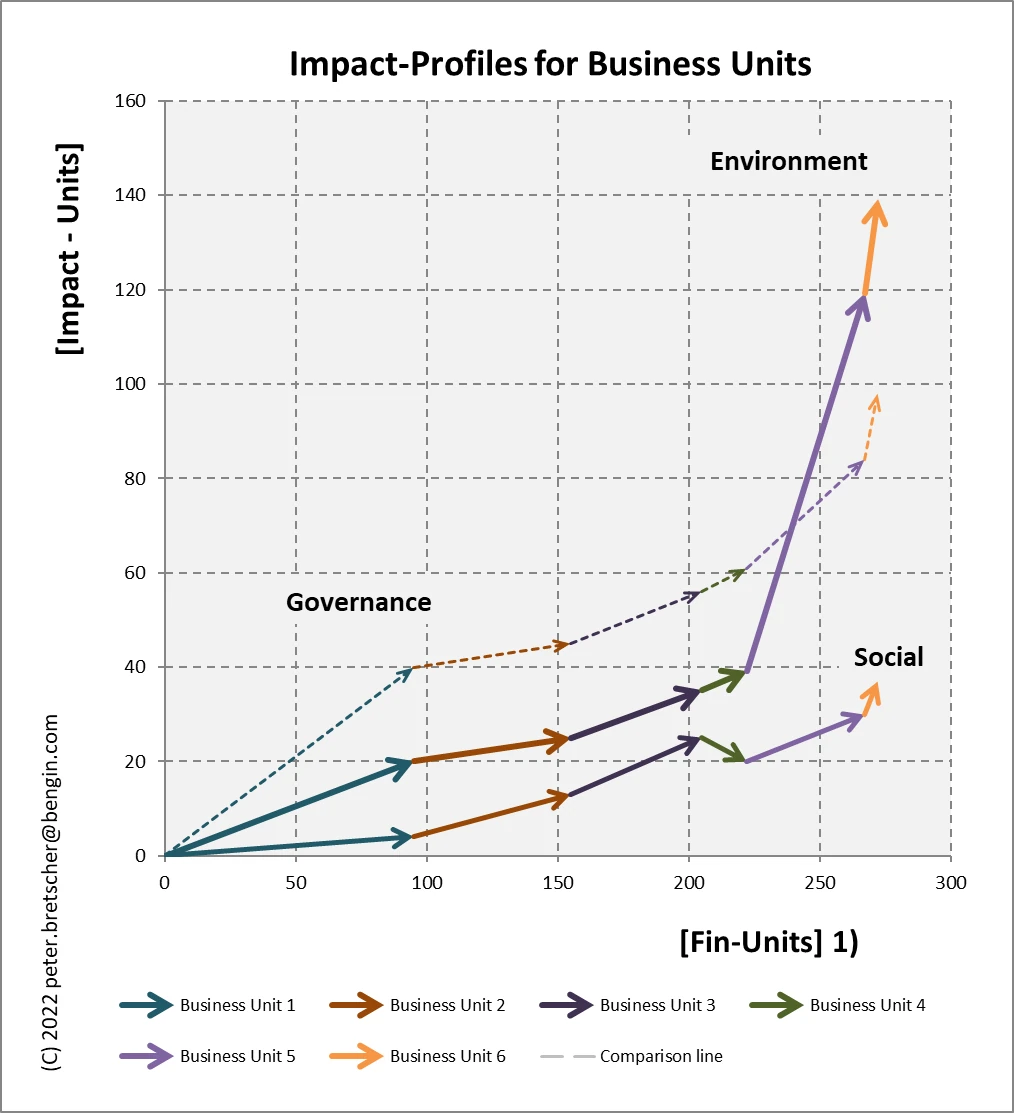
Impact-Profiles - new dimensions for (otherwise) hidden insights.
New transparecy using Hybrid Metrics & Hybrid Reporting - beyond linear KPIs.
There are hundreds of KPIs in several frameworks (ESG, SDG, GRI, ISSB...) for getting an overview about the impact that the output of an enterprise has to environment, social and governance.
Any mind can easily get lost in the amount of numbers.
And it is extremely challenging to recognize the correct significance of the numbers in the context of the investments made for them. Risk of misinterpretation and failures are rising with the complexity of the task.
What about an improved overview about impact of several Business Units or enterprises, investments, timeframes... about outliers (positive and negative)? And how to communicate the complex insights?
A unique art of visualization helps.
We use two dimensions to combine monetary and non-monetary properties of any object - even Environment, Social and Governance impact.
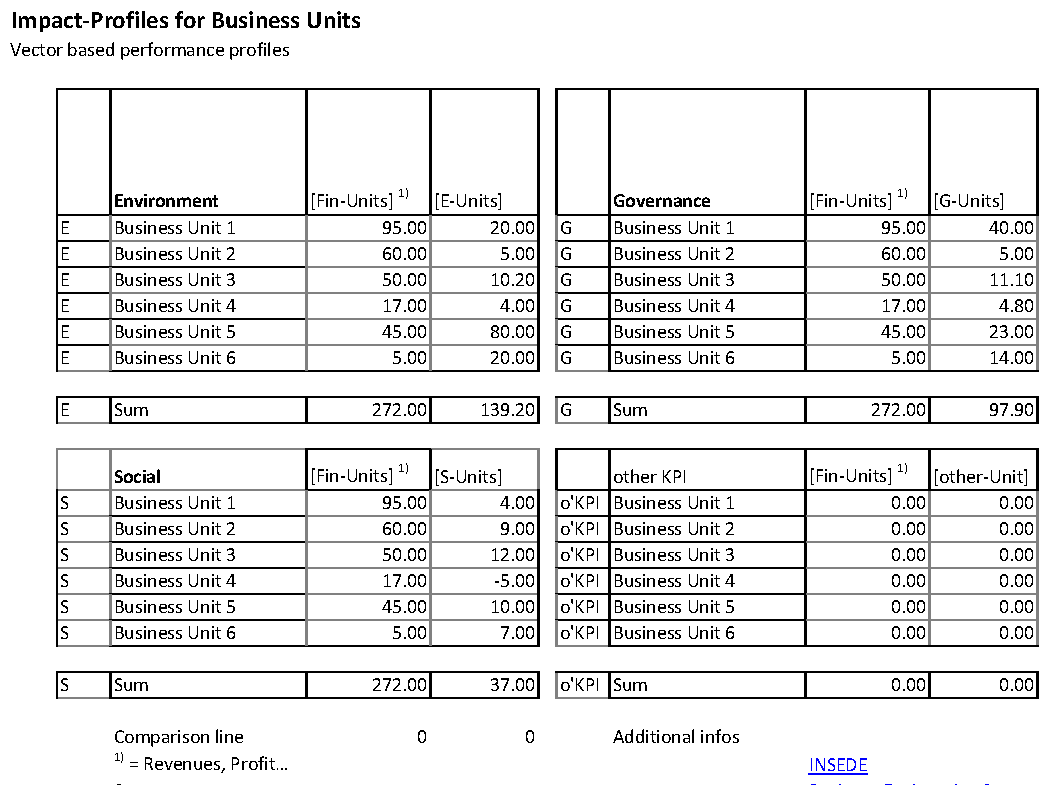
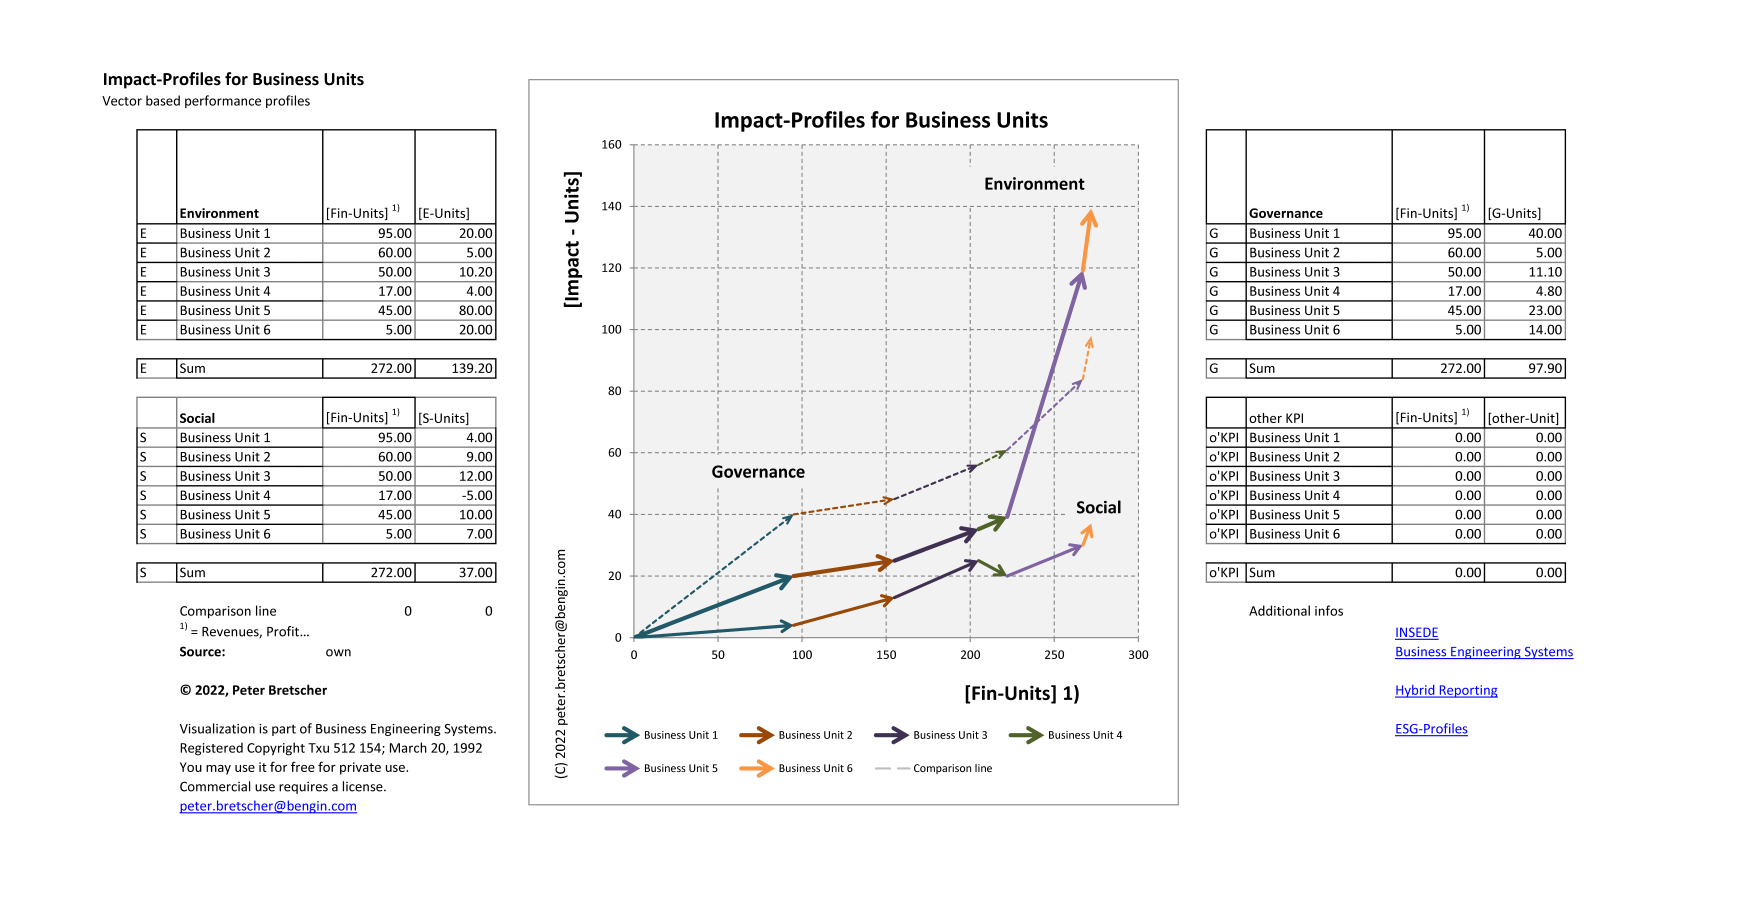
Now, as a world premiere, we are happy to disclose the first Impact-Profile that anyone can create using Standard Microsoft EXCEL. Without macros.
No investment in software or other operational equipment.
Even controlling and also accounting are now able to show interdependencies and recognize optimizations.
Try it yourself. Just download the free Excel template and change it to your needs - make drilldowns in additional sheets to see the details.
Impact-Profile is part of 'Business Engineering Systems' (tools for smarter economy) - registered Copyright TXu 512 154 - commercial use needs adequate license - trials and private use is free (no derivatives) - want to know more? -> e-mail: peter.bretscher@bengin.com
Combine Impact-indicator with investment - get enhanced insights.
Try Impact-Profiles yourself with your specific data.
Download free Excel template here.
Other Options for insights using Hybrid Metrics.
Visualizing is key for better transfer of insights to others' understanding.
Below some solutions from the "measuring and visualizing multidimensional metrics" part. Download and try Excel templates. No registration needed.
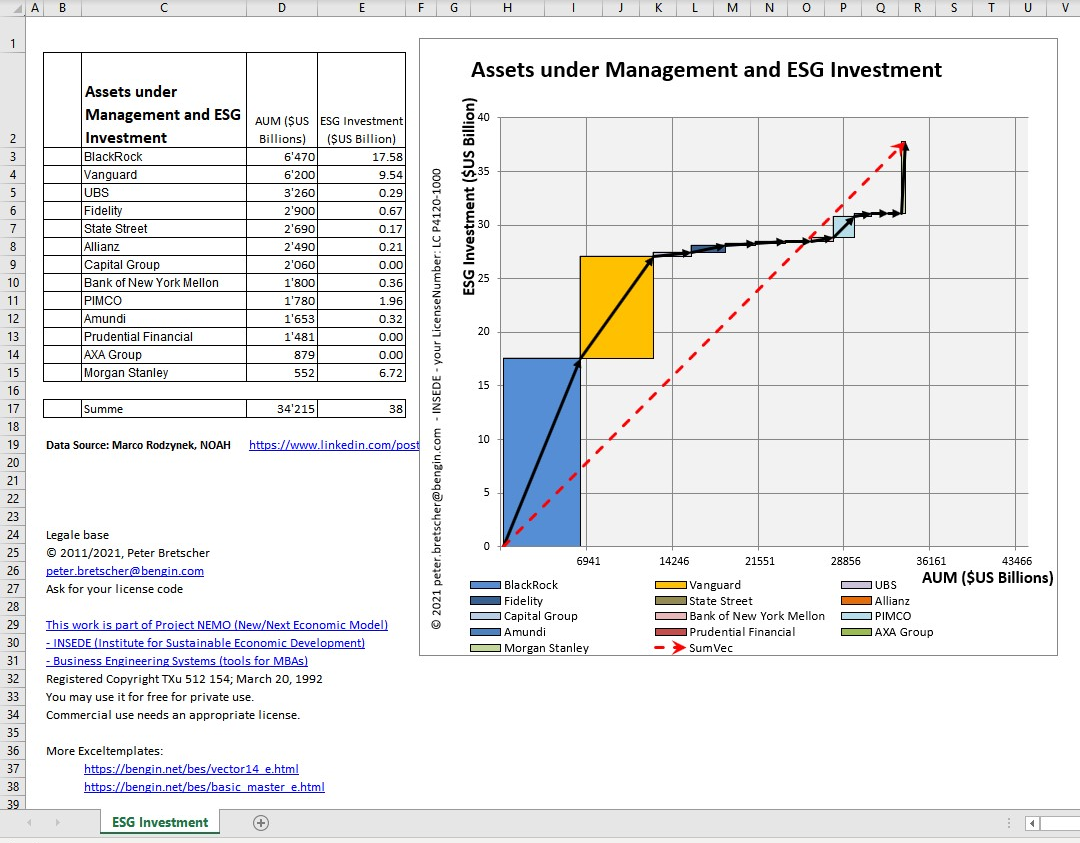
Hybrid Metrics in Boxes.
Download Excel

Numbers visualized in a profile -
Download Excel Template here

Another visualization option
Enhanced Excel Template here
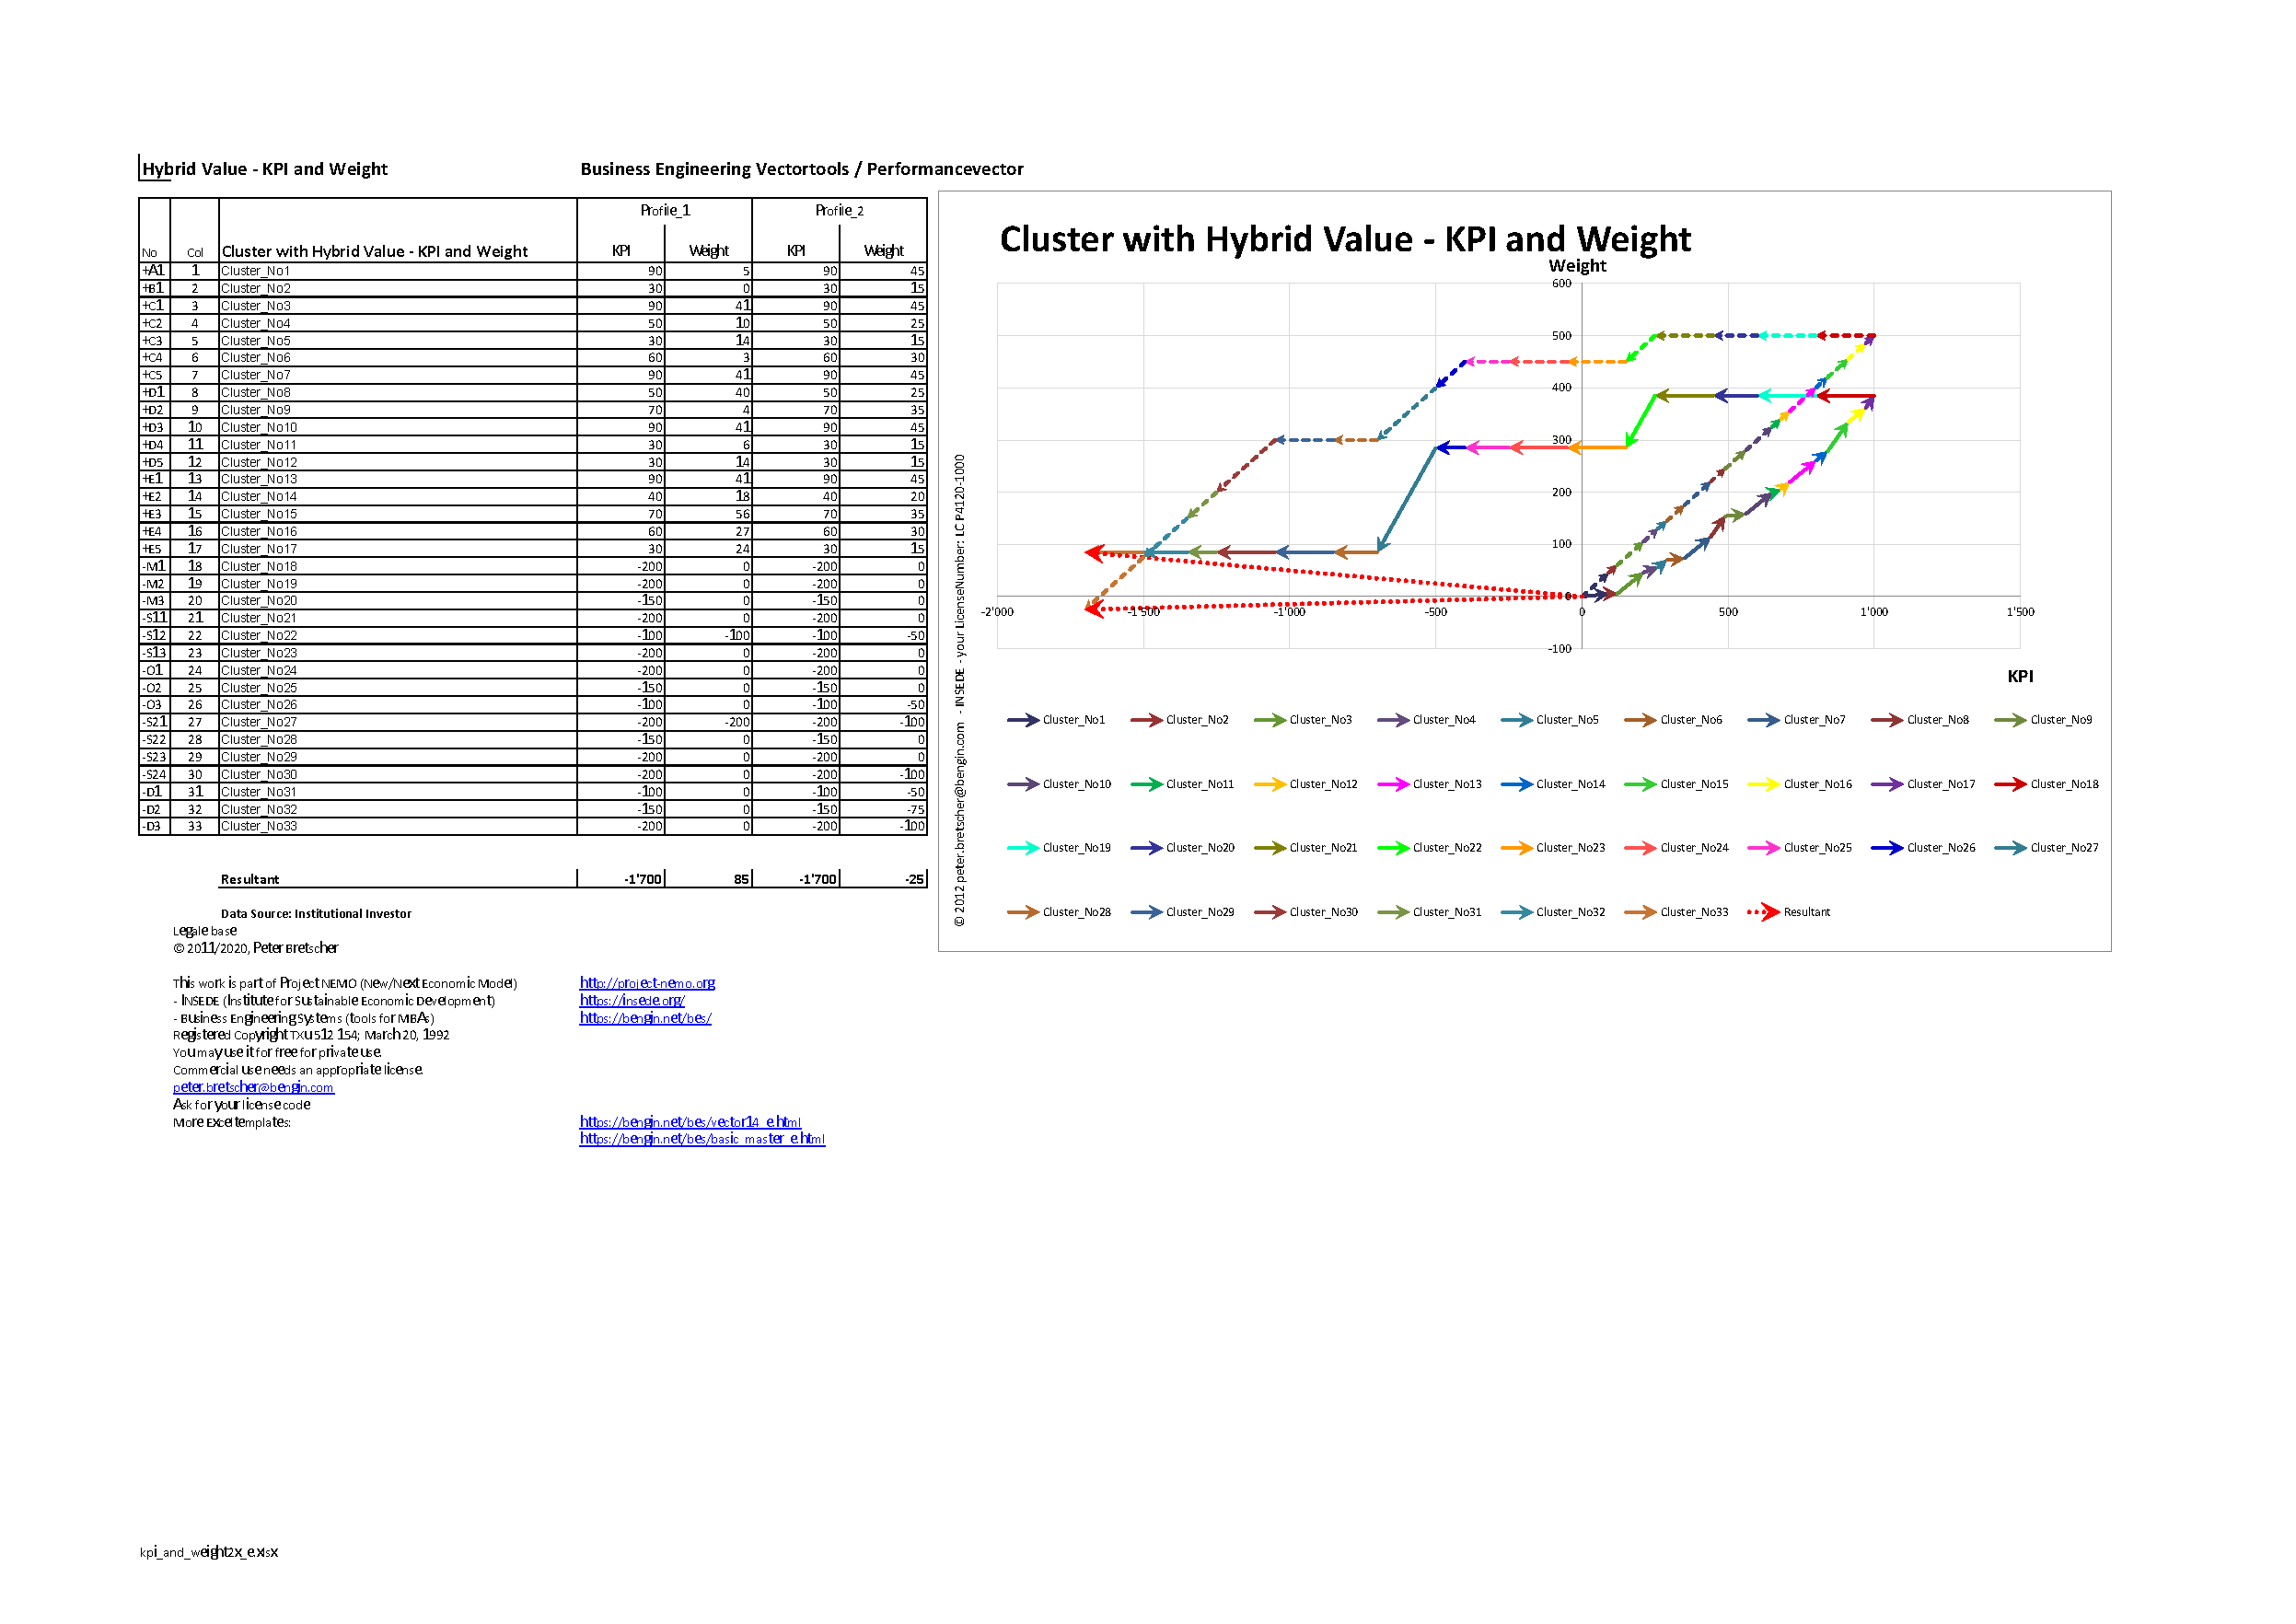
Want to compare two profiles? Download template here
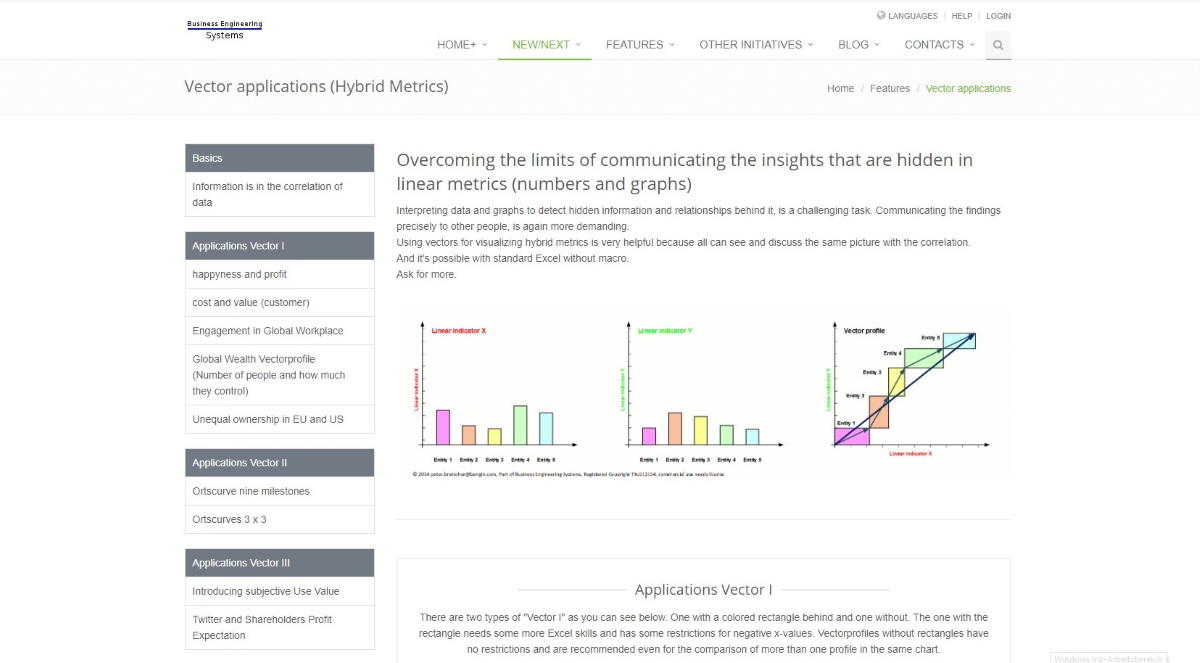
Go to visualizing Hybrid Metrics as Value Profiles in EXCEL.
Go to templates

Go to interactive Excel (in web) at "winformation.org"
link here
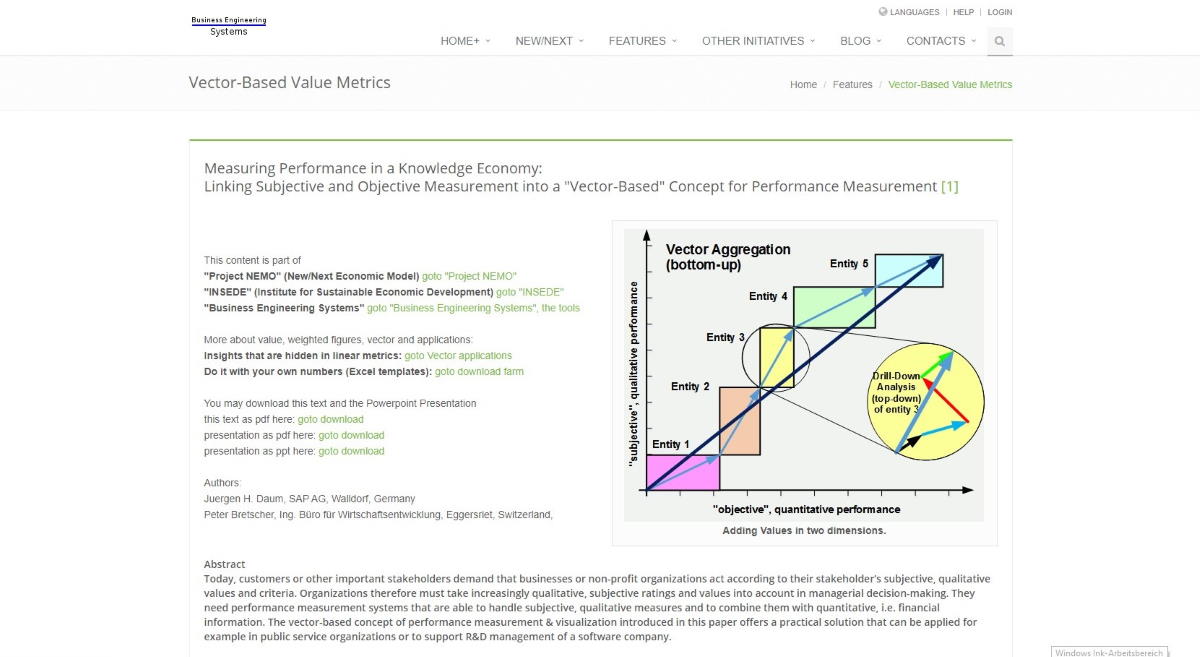
Read "Measuring Performance" in Hybrid Metrics Framework
link here
Take the experience of FSG using Hybrid Metrics.
Go to the FSG special page.
Purpose of 'Project NEMO' (New/Next Economic Model) is to enhance classic economics by
(i) including intangible assets as the common (re)source of welfare and wealth and
(ii) disclosing a vector based hybrid value principle enabling monetary AND nonmonetary dimensions as a compound/hybrid measure.

